Multiple Choice
Which one of the following graphs shows the rate at which heat is emitted from a hot body as a function of its Kelvin temperature T? 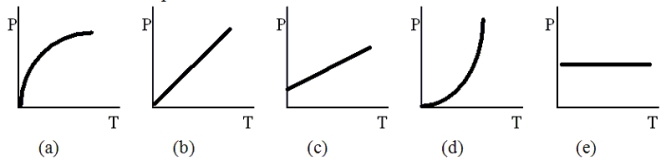
A) (A)
B) (B)
C) (C)
D) (D)
E) (E)
Correct Answer:

Verified
Correct Answer:
Verified
Related Questions
Q19: If a beaker of water is placed
Q20: Which of the following materials is the
Q21: Complete the following statement: The space between
Q22: A person steps out of the shower
Q23: Complete the following statement: The transfer of
Q25: Two bars,A and B,each of length 2.0
Q26: On a cold winter day,the outside temperature
Q27: Two identical solid spheres have the same
Q28: Heat is conducted by two cylindrical rods,one
Q29: Two bars,A and B,each of length 2.0