Multiple Choice
The graph shows the variation in radiation intensity per unit wavelength versus wavelength for a perfect blackbody at temperature T. 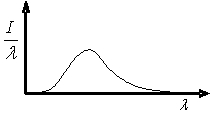 Complete the following statement: As the blackbody temperature is increased,the peak in intensity of this curve
A) will remain constant.
B) will be shifted to longer wavelengths and its magnitude will increase.
C) will be shifted to shorter wavelengths and its magnitude will increase.
D) will be shifted to longer wavelengths and its magnitude will decrease.
E) will be shifted to shorter wavelengths and its magnitude will decrease.
Correct Answer:

Verified
Correct Answer:
Verified
Q38: In the Compton scattering experiment shown in
Q39: White light consisting of wavelengths 380 nm
Q40: A physicist wishes to produce electrons by
Q41: Which one of the following is demonstrated
Q42: Which one of the following quantities is
Q44: What kinetic energy must each neutron in
Q45: The position of a 1-g object moving
Q46: A laser produces 3.0 W of light
Q47: Upon which one of the following parameters
Q48: A physicist wishes to produce electrons by