Multiple Choice
Figure 1A.1
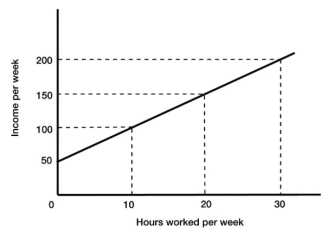
-Refer to Figure 1A.1. The slope of the line between the points where income equals 50 and income equals 200 is
A) 0.2.
B) 5.
C) 10.
D) 50.
Correct Answer:

Verified
Correct Answer:
Verified
Related Questions
Q2: Recall the Application about the government of
Q4: One example of a microeconomic question is,
Q5: The effort used to coordinate the factors
Q6: Which of the following is a question
Q9: The financial crisis and recession which began
Q10: Which of the following is a macroeconomic
Q12: If the price of a 32GB memory
Q16: Because resources are limited,<br>A) only the very
Q166: Normative economics<br>A) is the focus of most
Q204: Macroeconomics is best described as the study