Multiple Choice
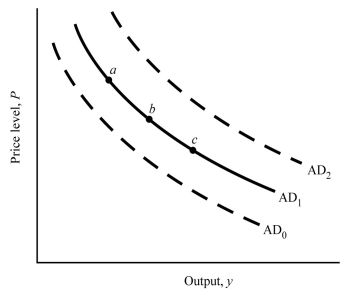 Figure 14.1
-Figure 14.1 shows three aggregate demand curves. A movement from point b to point c could be caused by a(n)
A) increase in the money supply.
B) decrease in taxes.
C) decrease in the price level.
D) decrease in government spending.
Correct Answer:

Verified
Correct Answer:
Verified
Q40: Output in the short run is determined
Q49: The purchasing power of money increases as
Q57: The economy's ability to coordinate economic activity
Q69: Adjustments in _ take the economy from
Q73: Adverse supply shocks can cause a recession
Q74: <img src="https://d2lvgg3v3hfg70.cloudfront.net/TB6799/.jpg" alt=" Figure 14.1 -Figure
Q74: The ratio of the total shift in
Q77: During an economic boom, output exceeds potential
Q82: <img src="https://d2lvgg3v3hfg70.cloudfront.net/TB6799/.jpg" alt=" Figure 14.2 -Refer
Q102: Suppose the demand for hamburgers increases. In