Multiple Choice
According to the following graphic, X and Y have ___. 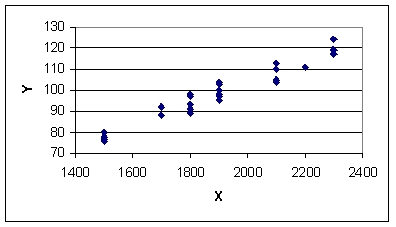
A) strong negative correlation
B) virtually no correlation
C) strong positive correlation
D) moderate negative correlation
E) weak negative correlation
Correct Answer:

Verified
Correct Answer:
Verified
Q17: Given a set of paired data, {X,
Q19: The following data is to be used
Q21: A researcher has developed the regression equation
Q25: The equation of a regression line is
Q27: Suppose for a given data set the
Q42: In regression,the predictor variable is called the
Q51: The numerical value of the coefficient of
Q68: A manager wants to predict the cost
Q70: <img src="https://d2lvgg3v3hfg70.cloudfront.net/TB6468/.jpg" alt=" -For a certain
Q71: <img src="https://d2lvgg3v3hfg70.cloudfront.net/TB6468/.jpg" alt=" -In the regression