Multiple Choice
According to the following graphic, X and Y have ___. 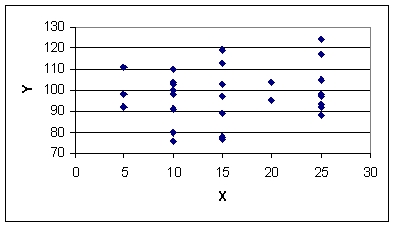
A) strong negative correlation
B) virtually no correlation
C) strong positive correlation
D) moderate negative correlation
E) weak negative correlation
Correct Answer:

Verified
Correct Answer:
Verified
Related Questions
Q9: The difference between the actual y value
Q27: Which of the following assertions is true
Q28: The process of constructing a mathematical model
Q30: Louis Katz, a cost accountant at Papalote
Q34: For the following scatter plot and regression
Q36: A manager at a local bank analyzed
Q37: If there is positive correlation between two
Q39: If there is perfect negative correlation between
Q70: In a simple regression the coefficient of
Q83: The total of the squared residuals is