Multiple Choice
The following residuals plot indicates ___. 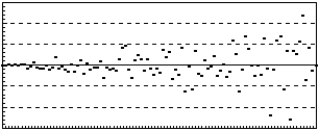
A) a nonlinear relation
B) a nonconstant error variance
C) the simple regression assumptions are met
D) the sample is biased
E) the sample is random
Correct Answer:

Verified
Correct Answer:
Verified
Related Questions
Q30: Prediction intervals get narrower as we extrapolate
Q41: A researcher has developed the regression equation
Q48: A quality manager is developing a regression
Q49: The coefficient of determination is the proportion
Q62: For the regression line,y = 21 −
Q79: One of the assumptions made in simple
Q84: A manager wishes to predict the annual
Q102: Consider the following scatter plot and regression
Q104: Annie Mikhail, market analyst for a national
Q107: The standard error of the estimate, denoted