Multiple Choice
The following residuals plot indicates ___. 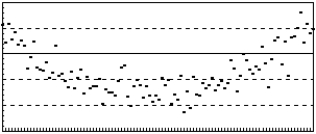
A) a nonlinear relation
B) a nonconstant error variance
C) the simple regression assumptions are met
D) the sample is biased
E) a random sample
Correct Answer:

Verified
Correct Answer:
Verified
Related Questions
Q4: If the correlation coefficient between two variables
Q6: A simple regression model for 10 pair
Q7: The following data represent the demand (Y)
Q8: If the correlation coefficient between variables X
Q10: A simple regression model resulted in a
Q11: Louis Katz, a cost accountant at Papalote
Q13: Regression methods can be pursued to estimate
Q13: A manager at a local bank analyzed
Q14: Annie Mikhail, market analyst for a national
Q32: The slope of the regression line,y =