Multiple Choice

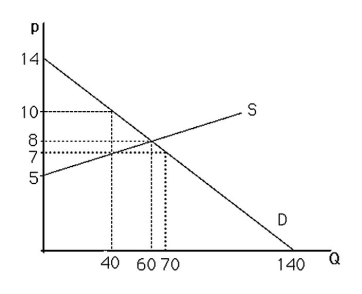
-The above figure shows a graph of the market for pizzas in a large town.If the price increases from $7 to $8 per pizza,the quantity of pizzas supplied will
A) increase by 30.
B) increase by 20.
C) decrease by 10.
D) decrease by 20.
Correct Answer:

Verified
Correct Answer:
Verified
Q33: A leftward shift of the supply curve
Q34: Use a supply-and-demand graph to predict what
Q35: Assume the price of a movie is
Q36: An increase in the demand curve for
Q37: <img src="https://d2lvgg3v3hfg70.cloudfront.net/TB6808/.jpg" alt=" -The above figure
Q39: Suppose an individual inverse demand curve is
Q40: Considering that the U.S.places a quota on
Q41: Because people prefer name-brand pain-relieving drugs over
Q42: During the winter of 1997-1998,the northeastern United
Q43: Consumer groups tend to lobby for<br>A) price