Essay
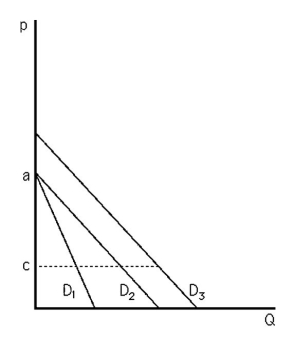
-The above figure shows three demand curves labeled D1,D2,and D3.Rank these three demand curves in terms of elasticity at a price of c.
Correct Answer:

Verified
First,compare D1 to D2.
Moving from price ...View Answer
Unlock this answer now
Get Access to more Verified Answers free of charge
Correct Answer:
Verified
First,compare D1 to D2.
Moving from price ...
Moving from price ...
View Answer
Unlock this answer now
Get Access to more Verified Answers free of charge
Related Questions
Q29: If the price elasticity of demand for
Q30: Relative to the short-run demand for gasoline,the
Q31: If a government wants to maximize revenues
Q32: If a consumer doubles her quantity of
Q33: Suppose the demand function for a good
Q35: <img src="https://d2lvgg3v3hfg70.cloudfront.net/TB6808/.jpg" alt=" -The above figure
Q36: As the demand for corn increases to
Q37: Which good would you expect to have
Q38: Suppose that an ad valorem tax of
Q39: If the demand curve for a good