Multiple Choice
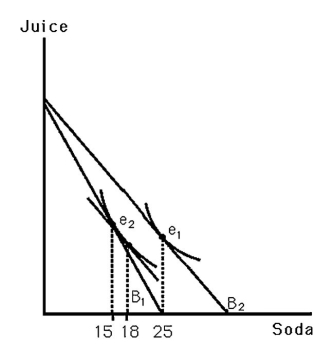
-The above figure shows Bobby's indifference map for soda and juice.B1 indicates his original budget line.B2 indicates his budget line resulting from a decrease in the price of soda.What change in quantity best represents his income effect?
A) 3
B) 10
C) 15
D) 7
Correct Answer:

Verified
Correct Answer:
Verified
Q107: <img src="https://d2lvgg3v3hfg70.cloudfront.net/TB6808/.jpg" alt=" -The above figure
Q108: In response to an increase in the
Q109: Due to inflation,nominal prices are usually<br>A) equal
Q110: <img src="https://d2lvgg3v3hfg70.cloudfront.net/TB6808/.jpg" alt=" -In the above
Q111: A true cost-of-living adjustment (COLA)in response to
Q113: When the price of a good changes,the
Q114: An increase in the price of a
Q115: If a good is an inferior good,then
Q116: <img src="https://d2lvgg3v3hfg70.cloudfront.net/TB6808/.jpg" alt=" -The above figure
Q117: Recent data has shown that income and