Multiple Choice
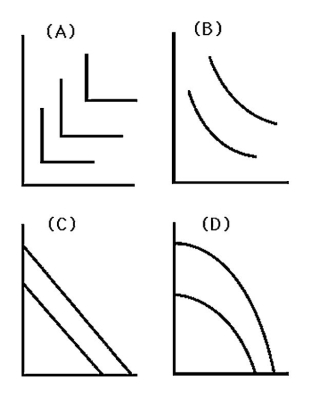
-Which graph in the above figure represents the isoquants where,as the amount of labor used increases and the amount of capital used decreases,the marginal product of labor rises when capital per day is on the vertical axis and labor per day is on the horizontal axis?
A) Graph A
B) Graph B
C) Graph C
D) Graph D
Correct Answer:

Verified
Correct Answer:
Verified
Q68: A firm is currently producing 100 widgets
Q69: Skateboards are produced according to the production
Q70: Describe the relationship between marginal productivity and
Q71: <img src="https://d2lvgg3v3hfg70.cloudfront.net/TB6808/.jpg" alt=" -The above figure
Q72: <img src="https://d2lvgg3v3hfg70.cloudfront.net/TB6808/.jpg" alt=" -The above figure
Q74: Total Product is<br>A) the change in total
Q75: The Marginal Product of Labor is<br>A) the
Q76: In China,firms owned by the government are
Q77: Let the production function be q =
Q78: Technological efficiency is<br>A) a necessary and sufficient