Multiple Choice
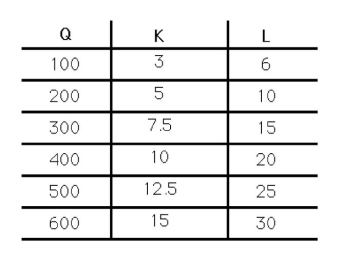
-The table in the above figure shows the levels of output resulting from different levels of inputs.Which of the following conclusions can be drawn from this information?
A) Increasing returns to scale exist between 100 and 200 units of output.
B) Constant returns to scale exist throughout all levels of production.
C) Labor is subject to diminishing marginal productivity in the short run.
D) No firm conclusions can be drawn.
Correct Answer:

Verified
Correct Answer:
Verified
Q90: Returns to scale is a concept that
Q91: Over a five-year span,the ABC Co.reduced the
Q92: Which of the following statements best summarizes
Q93: Suppose the production of paved roadways can
Q94: Let the production function be q =
Q96: Efficient production occurs if a firm<br>A) cannot
Q97: The slope of the total product curve
Q98: Production functions only apply to advanced economies.
Q99: <img src="https://d2lvgg3v3hfg70.cloudfront.net/TB6808/.jpg" alt=" -Lectures in microeconomics
Q100: Isoquants that are downward-sloping straight lines exhibit<br>A)