Multiple Choice
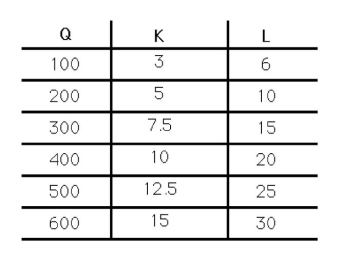
-The table in the above figure shows the levels of output resulting from different levels of inputs.Returns to scale are greatest at which level of output?
A) 100-200 units
B) 200-400 units
C) 400-600 units
D) There is insufficient information to answer the question.
Correct Answer:

Verified
Correct Answer:
Verified
Q1: <img src="https://d2lvgg3v3hfg70.cloudfront.net/TB6808/.jpg" alt=" -The above figure
Q2: Skateboards are produced according to the production
Q4: In the Primary Metals industry,it is estimated
Q5: To say that isoquants are convex is
Q6: What is one of the biggest differences
Q7: Suppose the production function for T-shirts can
Q8: Isoquants that are downward-sloping straight lines imply
Q9: If inputs into production cannot be substituted
Q10: A typical professional National Football League team
Q11: Dell computers has increased production efficiency by<br>A)