Essay
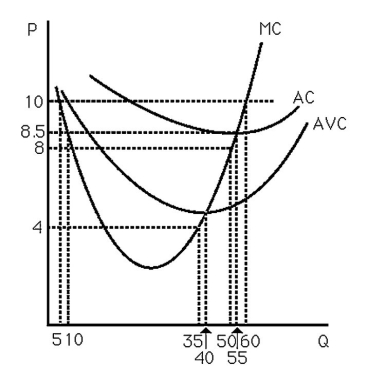
-The above figure shows the cost curves for a typical firm in a competitive market.Note that if p = 10,then MC = p at both q = 5 and q = 60.Can they both yield maximum profit? Explain.
Correct Answer:

Verified
No,at q = 5,p = MC,but this is not profi...View Answer
Unlock this answer now
Get Access to more Verified Answers free of charge
Correct Answer:
Verified
View Answer
Unlock this answer now
Get Access to more Verified Answers free of charge
Q50: If the long-run supply curve in a
Q51: If a competitive firm is in short-run
Q52: Many auction sites,such as eBay,provide a reputation
Q53: Draw a graph that shows how the
Q55: The "Got Milk?" advertising campaign is a
Q56: In a competitive market,if buyers did not
Q57: The competitive firm's supply curve is equal
Q58: Firms that exhibit price-taking behavior<br>A) wait for
Q59: <img src="https://d2lvgg3v3hfg70.cloudfront.net/TB6808/.jpg" alt=" -The above figure
Q103: If a competitive firm maximizes short-run profits