Essay
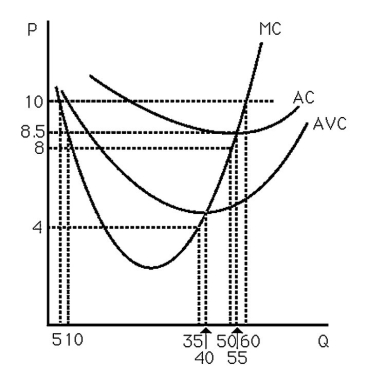
-The above figure shows the cost curves for a typical firm in a competitive market.From the graph,estimate the firm's profits when price equals $10 per unit.
Correct Answer:

Verified
When price = 10,p = MC when q ...View Answer
Unlock this answer now
Get Access to more Verified Answers free of charge
Correct Answer:
Verified
View Answer
Unlock this answer now
Get Access to more Verified Answers free of charge
Q37: A market is perfectly competitive even if
Q38: The perfectly competitive model makes a lot
Q39: <img src="https://d2lvgg3v3hfg70.cloudfront.net/TB6808/.jpg" alt=" -The above figure
Q40: Suppose that for each firm in the
Q41: Markets with hit-and-run entry and exit experience<br>A)
Q43: Firms in long-run perfect competition produce at<br>A)
Q44: All else equal,a smaller elasticity of the
Q45: Many car owners and car dealers describe
Q46: If a firm operates in a perfectly
Q47: <img src="https://d2lvgg3v3hfg70.cloudfront.net/TB6808/.jpg" alt=" -The above figure