Multiple Choice
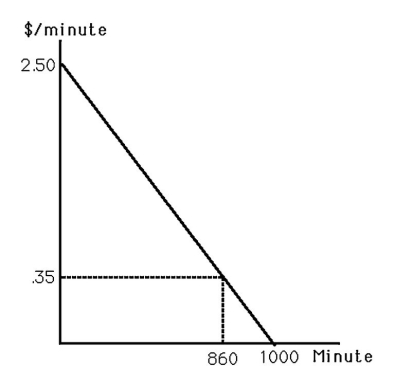
-The above figure shows the market demand curve for telecommunication while driving one's car (time spent on the car phone) .If the price were zero,consumer surplus equals
A) $301.00.
B) $924.50.
C) $1,225.50.
D) $1,250.00.
Correct Answer:

Verified
Correct Answer:
Verified
Q105: In a competitive market,the demand and supply
Q106: <img src="https://d2lvgg3v3hfg70.cloudfront.net/TB6808/.jpg" alt=" -The above figure
Q107: Even if two competitive firms in the
Q108: If lower-income households spend a greater share
Q109: Producer surplus is the sum of the
Q111: If a market produces a level of
Q112: If a city decides to lift restrictions
Q113: What is one reason activists might lobby
Q114: Long-run economic profit does not exist for
Q115: <img src="https://d2lvgg3v3hfg70.cloudfront.net/TB6808/.jpg" alt=" -The above figure