Multiple Choice
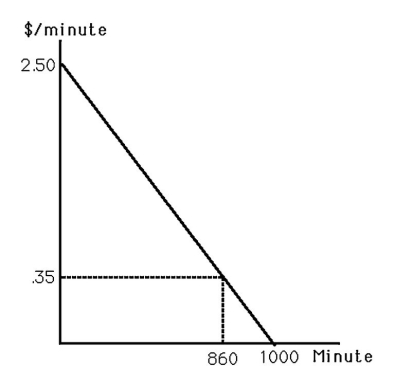
-The above figure shows the market demand curve for telecommunication while driving one's car (time spent on the car phone) .If the price were $2.50,consumer surplus equals
A) $301.00.
B) $924.50.
C) $1,225.50.
D) $0
Correct Answer:

Verified
Correct Answer:
Verified
Related Questions
Q82: Before the DVD,the VCR was a popular
Q83: The tax revenue that is generated by
Q84: Suppose anyone with a driver's license is
Q85: Ann and Bill each spend $30 per
Q86: Mister Jones was selling his house.The asking
Q88: If entry is limited due to a
Q89: <img src="https://d2lvgg3v3hfg70.cloudfront.net/TB6808/.jpg" alt=" -The above figure
Q90: Tariffs and quotas create a loss in
Q91: In the long-run equilibrium in perfect competition,consumer
Q92: Mister Jones was selling his house.The asking