Short Answer
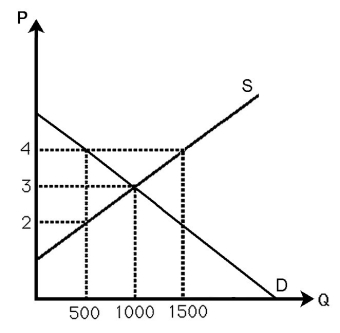
-The above figure shows the demand and supply curves in the market for milk.If the government imposes a quota at 500 gallons,calculate the deadweight loss.
Correct Answer:

Verified
DWL = .5(4...View Answer
Unlock this answer now
Get Access to more Verified Answers free of charge
Correct Answer:
Verified
View Answer
Unlock this answer now
Get Access to more Verified Answers free of charge
Q10: You enter a store and buy a
Q11: <img src="https://d2lvgg3v3hfg70.cloudfront.net/TB6808/.jpg" alt=" -The above figure
Q12: In a competitive market,the demand and supply
Q13: Measuring society's welfare as 2*CS + 0.5*PS<br>A)
Q14: Sarah's demand curve for shoes has the
Q16: <img src="https://d2lvgg3v3hfg70.cloudfront.net/TB6808/.jpg" alt=" -The above figure
Q17: <img src="https://d2lvgg3v3hfg70.cloudfront.net/TB6808/.jpg" alt=" -The above figure
Q18: A per unit subsidy increases both consumer
Q19: In the long-run equilibrium in perfect competition,<br>A)
Q20: <img src="https://d2lvgg3v3hfg70.cloudfront.net/TB6808/.jpg" alt=" -The above figure