Multiple Choice
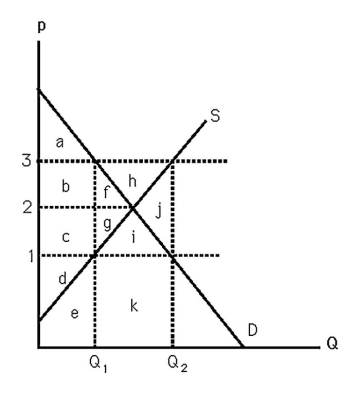
-The above figure shows supply and demand curves for milk.If the government passes a $2 per gallon specific tax,the loss in social welfare will equal
A) b + c + f + g.
B) f + g.
C) b + f.
D) c + g.
Correct Answer:

Verified
Correct Answer:
Verified
Q56: <img src="https://d2lvgg3v3hfg70.cloudfront.net/TB6808/.jpg" alt=" -The above figure
Q57: The larger the U.S.imposed per unit import
Q58: <img src="https://d2lvgg3v3hfg70.cloudfront.net/TB6808/.jpg" alt=" -The above figure
Q59: Which of the following is NOT a
Q60: What is one reason firms might lobby
Q62: Sarah and David both have linear demand
Q63: Suppose a farmer in a perfectly competitive
Q64: Assume government policy increases the demand for
Q65: What is one reason activists might lobby
Q66: A new law applied to a competitive