Multiple Choice
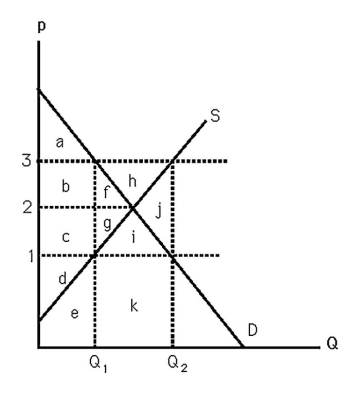
-The above figure shows supply and demand curves for milk.Suppose that the government passes a $2 per gallon subsidy.The deadweight loss resulting from this policy will be
A) j.
B) f + g.
C) b + c + f + g.
D) c + g.
Correct Answer:

Verified
Correct Answer:
Verified
Q113: What is one reason activists might lobby
Q114: Long-run economic profit does not exist for
Q115: <img src="https://d2lvgg3v3hfg70.cloudfront.net/TB6808/.jpg" alt=" -The above figure
Q116: <img src="https://d2lvgg3v3hfg70.cloudfront.net/TB6808/.jpg" alt=" -The above figure
Q117: <img src="https://d2lvgg3v3hfg70.cloudfront.net/TB6808/.jpg" alt=" -The above figure
Q119: The services of real estate brokers are
Q120: An increase in the deadweight loss (DWL)means<br>A)
Q121: <img src="https://d2lvgg3v3hfg70.cloudfront.net/TB6808/.jpg" alt=" -The above figure
Q122: A minimum wage is an example of
Q123: Explain why the competitive output maximizes welfare.