Multiple Choice
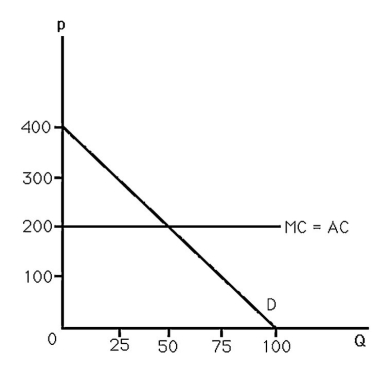
-The above figure shows the demand and cost curves facing a monopoly.The monopoly maximizes profit by selling
A) 0 units.
B) 25 units.
C) 50 units.
D) 75 units.
Correct Answer:

Verified
Correct Answer:
Verified
Related Questions
Q82: The longer a patent lasts,<br>A) the greater
Q83: Explain Microsoft Windows' monopoly positions in terms
Q84: If the inverse demand curve a monopoly
Q85: Why is the monopoly total welfare lower
Q86: A monopoly incurs a marginal cost of
Q88: The deadweight loss represents the sum of
Q89: Suppose a monopolist has TC = 100
Q90: Which of the following total cost functions
Q91: If the inverse demand curve a monopoly
Q92: Which of the following DOES NOT contribute