Multiple Choice
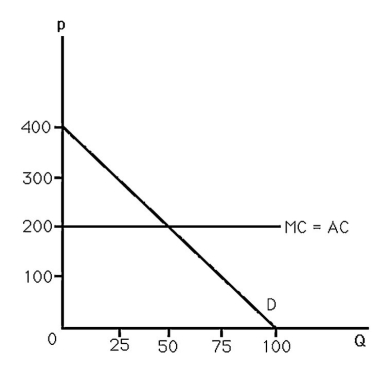
-The above figure shows the demand and cost curves facing a monopolist.The monopoly maximizes profit by setting price equal to
A) $100.
B) $200.
C) $300.
D) $400.
Correct Answer:

Verified
Correct Answer:
Verified
Related Questions
Q59: As the ratio of price to marginal
Q60: A justification for patents is that without
Q61: Firms that sell highly customized items such
Q62: <img src="https://d2lvgg3v3hfg70.cloudfront.net/TB6808/.jpg" alt=" -Suppose a monopolist
Q63: At the current level of output,a firm's
Q65: A monopolist faces the inverse demand curve
Q66: A monopolist faces the inverse demand curve
Q67: A monopoly can be formed by a
Q68: Patents<br>A) will create a profit incentive to
Q69: <img src="https://d2lvgg3v3hfg70.cloudfront.net/TB6808/.jpg" alt=" -The above figure