Multiple Choice
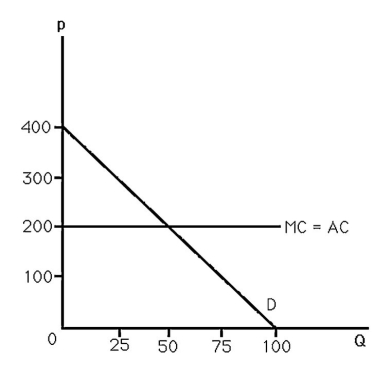
-The above figure shows the demand and cost curves facing a monopolist.This profit-maximizing monopoly has a revenue equal to
A) $1000.
B) $5200.
C) $7500.
D) $8000.
Correct Answer:

Verified
Correct Answer:
Verified
Related Questions
Q98: The more elastic the demand curve,a monopoly<br>A)
Q99: A monopoly faces an inverse demand curve
Q100: Regulation is guaranteed to be more efficient
Q101: The less elastic is the demand for
Q102: The average cost for a typical electric-power-production
Q104: The situation where one person's demand for
Q105: A monopoly sets a price of $50
Q106: <img src="https://d2lvgg3v3hfg70.cloudfront.net/TB6808/.jpg" alt=" -The above figure
Q107: Which of the following markets is closest
Q108: Suppose a monopolist has TC = 40