Multiple Choice
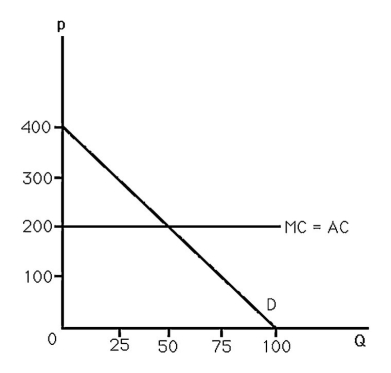
-The above figure shows the demand and cost curves facing a monopoly.The deadweight loss of this monopoly is
A) $100.
B) $250.
C) $1,250.
D) $2,500.
Correct Answer:

Verified
Correct Answer:
Verified
Related Questions
Q129: One difference between a monopoly and a
Q130: If the government wants to regulate a
Q131: If the inverse demand function for a
Q132: For profit-maximizing monopolies,explain why the boundaries on
Q133: A monopoly does not have a supply
Q135: If the government attempts to force a
Q136: The Lerner Index is<br>A) the ratio of
Q137: Since there are no close substitutes for
Q138: If the demand for a monopoly's output
Q139: Market power guarantees profit.<br>A) True, which is