Multiple Choice
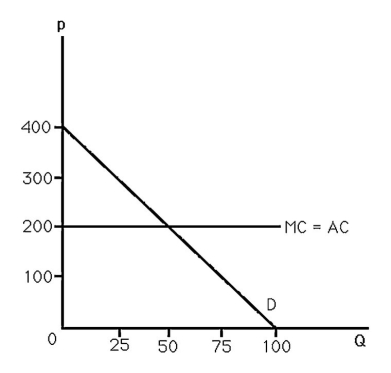
-The above figure shows the demand and cost curves facing a monopoly.In order to maximize its profit,the monopolist produces ________ less units than the competitive market level of output.
A) 15
B) 25
C) 50
D) 75
Correct Answer:

Verified
Correct Answer:
Verified
Related Questions
Q106: <img src="https://d2lvgg3v3hfg70.cloudfront.net/TB6808/.jpg" alt=" -The above figure
Q107: Which of the following markets is closest
Q108: Suppose a monopolist has TC = 40
Q109: If the inverse demand curve a monopoly
Q110: If the government's goal is to generate
Q112: Suppose a patent is granted for a
Q113: A flour mill holding exclusive contracts to
Q114: Limited government licenses that create a monopoly
Q115: If the monopoly's demand curve intersects the
Q116: An exclusive right to sell a new