Multiple Choice
The figure given below depicts the demand and supply of Brazilian reals in the foreign exchange market.Assume that the market operates under a flexible exchange rate regime. Figure 22.1 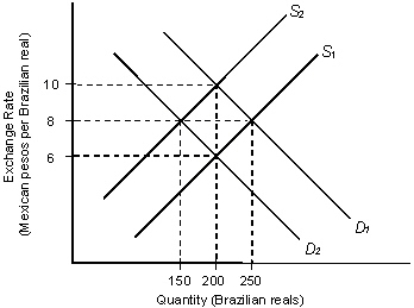 In the figure:
D1 and D2: Demand for Brazilian reals
S1 and S2: Supply of Brazilian reals
-Refer to Figure 22.1.Suppose the initial equilibrium exchange rate is 10 pesos per real.A decrease in the Mexican demand for Brazilian coffee,other things equal,is most likely to result in a new equilibrium exchange rate of:
A) 6 pesos per real and an equilibrium quantity of 200 Brazilian reals.
B) 6 pesos per real and an equilibrium quantity of 250 Brazilian reals.
C) 8 pesos per real and an equilibrium quantity of 150 Brazilian reals.
D) 8 pesos per real and an equilibrium quantity of 100 Brazilian reals.
E) 10 pesos per real and an equilibrium quantity of 200 Brazilian reals.
Correct Answer:

Verified
Correct Answer:
Verified
Q5: The figure given below depicts the foreign
Q22: The figure given below depicts the foreign
Q56: The figure given below depicts the foreign
Q63: The figure given below depicts the foreign
Q68: The figure given below depicts the foreign
Q70: The figure given below depicts the foreign
Q71: The figure below shows the demand (D)
Q78: The figure below shows the demand (D)
Q114: The figure below shows the demand (D)
Q120: The figure below shows the demand (D)