Multiple Choice
The figure given below depicts the demand and supply of Brazilian reals in the foreign exchange market.Assume that the market operates under a flexible exchange rate regime. Figure 22.1 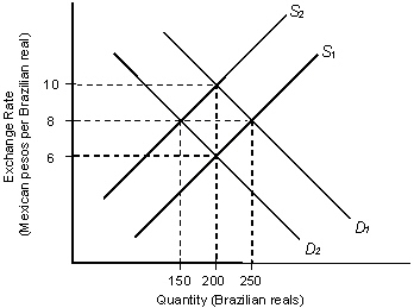 In the figure:
D1 and D2: Demand for Brazilian reals
S1 and S2: Supply of Brazilian reals
-Refer to Figure 22.1.The supply curves shown for Brazilian reals are based on:
A) the supply of Brazilian goods in the international market.
B) the Brazilian demand for Mexican products.
C) the supply of Mexican pesos in the market.
D) the Brazilian demand for Brazilian products.
E) the Mexican demand for Brazilian products.
Correct Answer:

Verified
Correct Answer:
Verified
Q12: The figure given below depicts the foreign
Q13: The figure below shows the demand (D)
Q25: The figure below shows the demand (D)
Q47: Equilibrium in the foreign exchange market occurs:<br>A)at
Q48: Suppose a hefty rise in the demand
Q50: Foreign exchange market intervention is most effective
Q54: Deviations from purchasing power parity will be
Q74: The figure given below depicts the foreign
Q88: The figure below shows the demand (D)
Q107: The figure given below depicts the foreign