Multiple Choice
The figure below shows revenue and cost curves of a natural monopoly firm. Figure 12.1 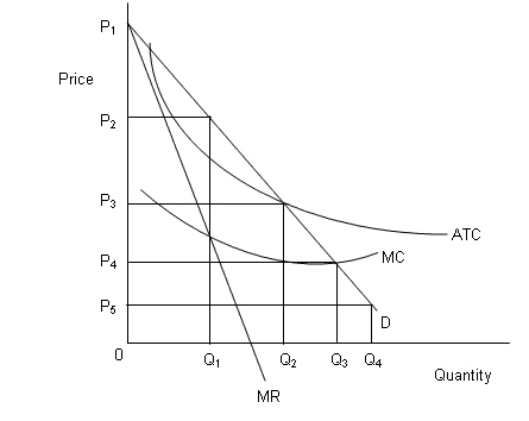 In the figure,
D: Demand curve
MR: Marginal revenue curve
MC: Marginal cost curve
ATC: Average total cost curve
-Refer to Figure 12.1.The natural monopolist will charge a price equal to:
A) P4.
B) P3.
C) P2.
D) P1.
E) P5.
Correct Answer:

Verified
Correct Answer:
Verified
Q9: In the following figure, the first panel
Q24: In the following figure, the first panel
Q63: In the following figure, the first panel
Q64: In the following figure, the first panel
Q73: <img src="https://d2lvgg3v3hfg70.cloudfront.net/TB1748/.jpg" alt=" -Which of the
Q86: The argument made in favor of privatization
Q86: In the following figure, the first panel
Q87: The first phase of antitrust policy in
Q90: Which of the following statements best describes
Q94: The most reliable measure of market concentration