Multiple Choice
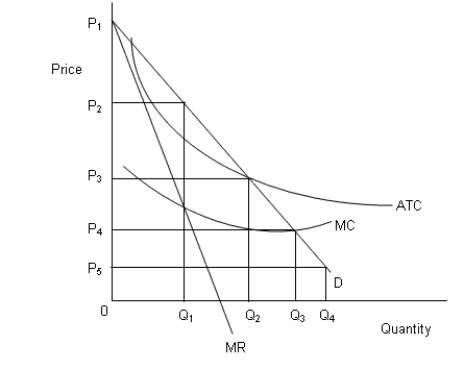
The figure below shows revenue and cost curves of a natural monopoly firm.Figure 14.1
 In the figure,
D: Demand curve
MR: Marginal revenue curve
MC: Marginal cost curve
ATC: Average total cost curve
-If social regulation causes the supply curve in a market to shift up because of higher marginal costs, then:
A) both consumer and producer surplus will decrease.
B) both producer and consumer surplus will increase.
C) consumers will gain at the expense of producers.
D) producers will gain at the expense of consumers.
E) there will be no change in the sum of producer and consumer surplus, although its division may change.
Correct Answer:

Verified
Correct Answer:
Verified
Q5: In the following figure, the first panel
Q6: <img src="https://d2lvgg3v3hfg70.cloudfront.net/TB1748/.jpg" alt=" -A market that
Q7: In the following figure, the first panel
Q8: <img src="https://d2lvgg3v3hfg70.cloudfront.net/TB1748/.jpg" alt=" -Which of the
Q9: In the following figure, the first panel
Q11: In the following figure, the first panel
Q12: In the following figure, the first panel
Q13: <img src="https://d2lvgg3v3hfg70.cloudfront.net/TB1748/.jpg" alt=" -What are the
Q14: <img src="https://d2lvgg3v3hfg70.cloudfront.net/TB1748/.jpg" alt=" -Which of the
Q15: <img src="https://d2lvgg3v3hfg70.cloudfront.net/TB1748/.jpg" alt=" -In an antitrust