Multiple Choice
In the following figure,the first panel shows a market situation prior to regulation and the second panel shows the effects of regulation. Figure 12.2 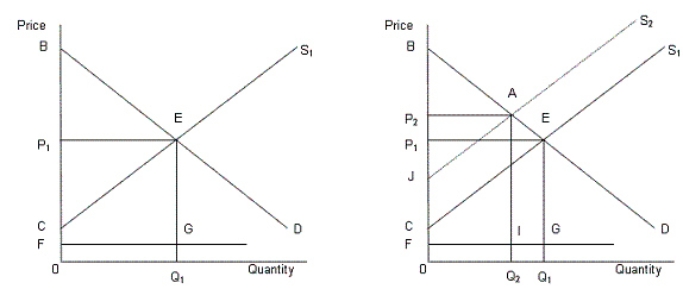 In the figure,
D: Demand curve for automobiles
S1: Supply curve of automobiles prior to regulation
S2: Supply curve of automobiles after regulation
FG: Clean up cost per unit
-According to Figure 12.2,the total societal surplus after the regulation is:
A) area BEC.
B) area AECJ.
C) area IGQ1Q2.
D) area 0FIQ2.
E) area BAJ.
Correct Answer:

Verified
Correct Answer:
Verified
Q1: <img src="https://d2lvgg3v3hfg70.cloudfront.net/TB1748/.jpg" alt=" -The judicial doctrine,
Q10: Which of the following are the three
Q12: If a market becomes deregulated and is
Q13: If social regulation increases a firm's fixed
Q26: <img src="https://d2lvgg3v3hfg70.cloudfront.net/TB1748/.jpg" alt=" -A Herfindahl index
Q31: In the following figure, the first panel
Q34: In the following figure, the first panel
Q43: In the following figure, the first panel
Q47: In the following figure, the first panel
Q69: <img src="https://d2lvgg3v3hfg70.cloudfront.net/TB1748/.jpg" alt=" -Antitrust policy is