Multiple Choice
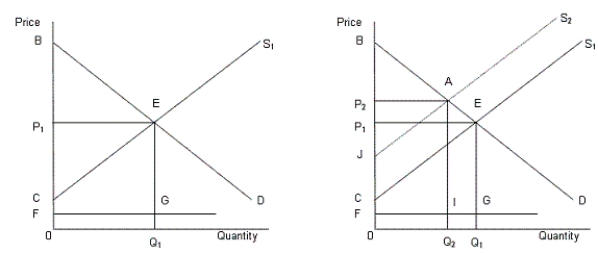
In the following figure, the first panel shows a market situation prior to regulation and the second panel shows the effects of regulation.Figure 14.2
 In the figure,
D: Demand curve for automobiles
S1: Supply curve of automobiles prior to regulation
S2: Supply curve of automobiles after regulation
FG: Clean up cost per unit
-Although the GATT was supported by most of the countries of the world, yet global trade shrank during the close of the last decade. This was due to:
A) growing suspicion among the nations of the world.
B) hyperinflation in the major economies of the world.
C) the recession which began in 2007.
D) political turmoil in the Asian countries.
E) the desire among the major players to dominate the international market.
Correct Answer:

Verified
Correct Answer:
Verified
Q26: <img src="https://d2lvgg3v3hfg70.cloudfront.net/TB1748/.jpg" alt=" -A Herfindahl index
Q27: In the following figure, the first panel
Q28: <img src="https://d2lvgg3v3hfg70.cloudfront.net/TB1748/.jpg" alt=" -Consider an oligopoly
Q29: In the following figure, the first panel
Q30: In the following figure, the first panel
Q32: <img src="https://d2lvgg3v3hfg70.cloudfront.net/TB1748/.jpg" alt=" -When regulators require
Q33: <img src="https://d2lvgg3v3hfg70.cloudfront.net/TB1748/.jpg" alt=" -The U.S. Justice
Q34: In the following figure, the first panel
Q35: In the following figure, the first panel
Q36: <img src="https://d2lvgg3v3hfg70.cloudfront.net/TB1748/.jpg" alt=" -Which of the