Multiple Choice
The figure below shows the revenue and cost curves of a monopolistically competitive firm. Figure: 11.2 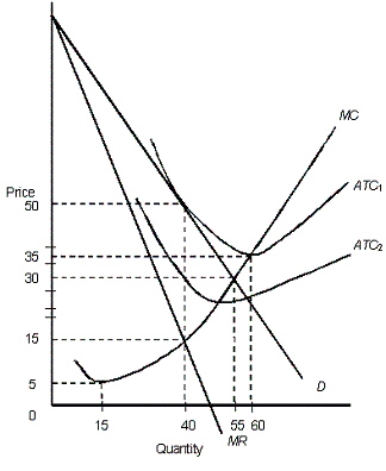 In the figure,
D: Demand curve
MR: Marginal revenue curve
ATC1 and ATC2: Average total cost curves
MC: Marginal cost curve
-In Figure 11.2,assume that the average total cost of the firm is represented by the curve ATC2.In the long run,we would expect:
A) entry of firms into the market because economic profits exist.
B) exit of firms from the market because the existing firms suffer economic losses.
C) that demand for each firm will increase.
D) the market to become perfectly competitive.
E) the market to become a monopoly.
Correct Answer:

Verified
Correct Answer:
Verified
Q22: The figure below shows the revenue and
Q41: Which of the following statements about a
Q43: The following table shows the payoff matrix
Q46: The figure given below shows the revenue
Q50: Suppose a monopolistically competitive firm is producing
Q57: The figure given below shows the revenue
Q65: The figure given below shows the revenue
Q96: The table below shows the payoff (profit)
Q108: The table below shows the payoff (profit)
Q111: The table below shows the payoff (profit)