Multiple Choice
The table below shows the payoff (profit) matrix of Firm A and Firm B indicating the profit outcome that corresponds to each firm's pricing strategy (where $500 and $200 are the pricing strategies of two firms) . Table 11.2 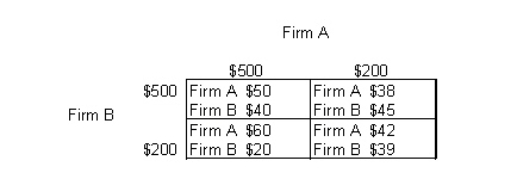
-Refer to Table 11.2.If firm B follows its dominant strategy but firm A does not,firm B will earn a profit of:
A) $45.
B) $40.
C) $20.
D) $60.
E) $50
Correct Answer:

Verified
Correct Answer:
Verified
Q10: When firms in an illegal market form
Q12: A most-favored customer is one who:<br>A)buys a
Q13: An oligopoly market consists of:<br>A)many firms which
Q14: The market structure in which the largest
Q17: Advertising,brand names,packaging,and celebrity endorsements all occur in
Q18: A cartel is an organization of firms
Q20: The table below shows the payoff (profit)
Q24: The figure given below shows the revenue
Q40: The following table shows the payoff matrix
Q55: The table below shows the payoff (profit)