Multiple Choice
The following figure shows the revenue curves of a monopolist: Figure 10.6 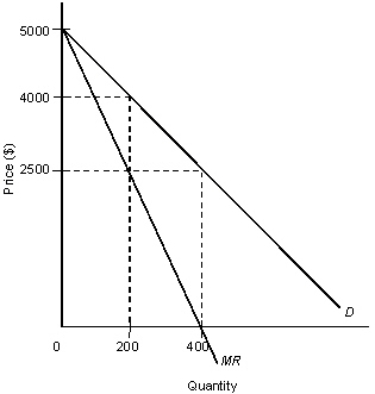
D: Average revenue
MR: Marginal revenue
-In Figure 10.6,assume that marginal costs are constant at $2,500 and fixed costs are zero.What price and output level would result from perfect competition?
A) P = $2,500,Q = 400
B) P = $2,500,Q = 200
C) P = $5,000,Q = 0
D) P = $4,000,Q = 400
E) P = $4,000,Q = 200
Correct Answer:

Verified
Correct Answer:
Verified
Q12: The figure given below shows the aggregate
Q38: The table given below shows the prices
Q41: The figures given below represent the revenue
Q44: The table given below shows the price
Q45: To practice price discrimination,a firm:<br>A)must be facing
Q46: The table given below shows the prices
Q48: Before World War II,Alcoa controlled the supply
Q49: The table given below shows the prices
Q56: The figure given below shows the cost
Q92: The figure given below shows the aggregate