Multiple Choice
The following figures show the demand and cost curves of a perfectly competitive and a monopoly firm respectively. Figure 10.7 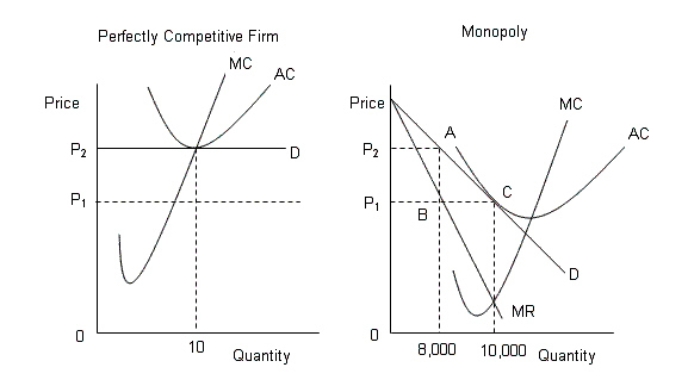
D: Average Revenue
AC: Average cost
MC: Marginal cost
MR: Marginal cost
-Refer to Figure 10.7.If the perfectly competitive industry and the monopoly produces the same quantity,then:
A) there are 10 firms in the perfectly competitive industry.
B) there are 800 firms in the perfectly competitive industry.
C) there are 1,000 firms in the perfectly competitive industry.
D) there are 2,000 firms in the perfectly competitive industry.
E) there are 100 firms in the perfectly competitive industry.
Correct Answer:

Verified
Correct Answer:
Verified
Q3: The marginal revenue curve of a monopolist
Q8: The table given below shows the prices
Q11: Which of the following is not a
Q17: The figures given below represent the revenue
Q21: The figure given below shows the cost
Q22: The figure given below shows the cost
Q23: The figure given below shows the aggregate
Q25: The figure given below shows the aggregate
Q37: The figures given below represent the revenue
Q67: The figure given below shows the cost