Multiple Choice
The following figures show the demand and cost curves of a perfectly competitive and a monopoly firm respectively. Figure 10.7 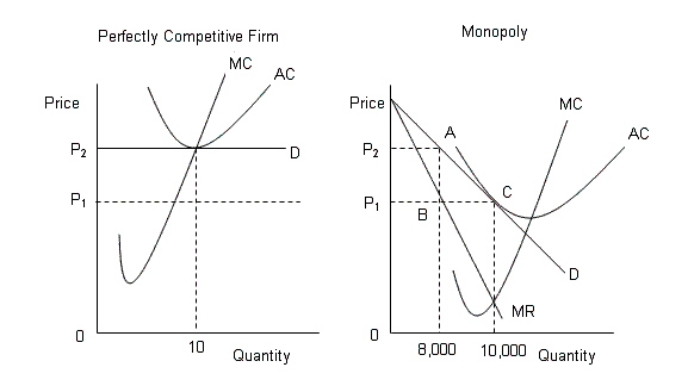
D: Average Revenue
AC: Average cost
MC: Marginal cost
MR: Marginal cost
-Calculate the deadweight loss in Figure 10.7,if the perfectly competitive industry is monopolized after it had been producing an output of 10,000 units?
A) The area P2ACP1
B) The area ABC
C) The area P2ABP1
D) The distance AB
E) There is no deadweight loss
Correct Answer:

Verified
Correct Answer:
Verified
Q8: The figure given below shows the demand
Q12: The figure given below shows the aggregate
Q32: The table given below shows the price,marginal
Q34: Why does a efficiency loss arise under
Q35: The figure given below shows the cost
Q36: Compared with a perfectly competitive market with
Q37: The following table shows the units of
Q38: The table given below shows the prices
Q49: The table given below shows the prices
Q94: The figure given below shows the cost