Multiple Choice
The following graph shows the marginal revenue (MR) and marginal cost (MC) curves of an imperfectly competitive firm. Figure 8.2 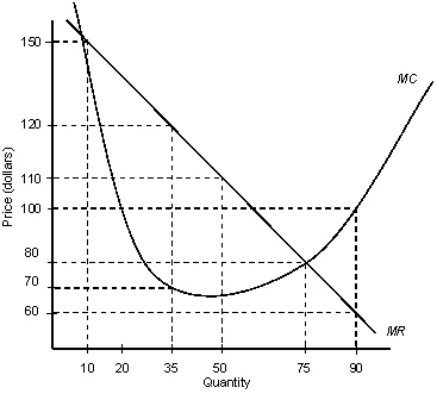
- According to Figure 8.2,the firm is maximizing profit at a quantity of _____ units.
A) 10
B) 35
C) 50
D) 75
E) 90
Correct Answer:

Verified
Correct Answer:
Verified
Related Questions
Q1: The table given below reports the marginal
Q5: If a firm's marginal revenue is greater
Q6: Scenario 8.1<br> Jane left her job at
Q7: In a perfectly competitive industry,the price of
Q8: The table given below reports the marginal
Q9: The table given below shows the total
Q10: Why does a monopolist face the market
Q10: Scenario 9.2<br>Consider a publicly held firm (one
Q21: Scenario 9.2<br>Consider a publicly held firm (one
Q114: The table given below reports the marginal