Multiple Choice
The below indifference map shows the various combinations of hours of music and apples that yield different levels of utility. Figure 6.1 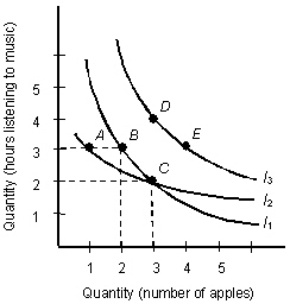
-According to indifference curve I1 in Figure 6.1,for each extra apple the consumer eats,he or she must simultaneously sacrifice ____ of listening to music to keep total utility constant.
A) 1 hour
B) 2 hours
C) 3 hours
D) 4 hours
E) 5 hours
Correct Answer:

Verified
Correct Answer:
Verified
Q12: Scenario 5.1<br>The demand for noodles is given
Q21: The below table shows the average utility
Q64: The table given below depicts the total
Q72: The below figure shows the various combinations
Q87: Total utility is determined by:<br>A)multiplying the quantity
Q90: The table given below reports the total
Q94: When economists describe the theory of consumer
Q97: When the price of a good changes,the
Q101: The table below shows the total utility
Q110: The below figure shows the various combinations