Multiple Choice
The below indifference map shows the various combinations of hours of music and apples that yield different levels of utility. Figure 6.1 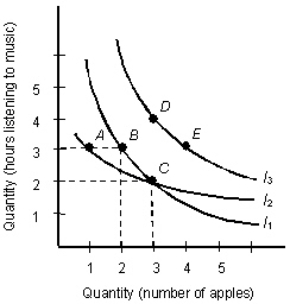
- According to Figure 6.1,which of the following is incorrect?
A) The consumer prefers B to A
B) The consumer is not indifferent between A and B
C) The consumer is indifferent between D and E
D) Indifference curve I2 should cross indifference curve I1 as shown
E) The consumer is indifferent between B and C
Correct Answer:

Verified
Correct Answer:
Verified
Q4: The table below shows the total utility
Q8: The table below shows the total utility
Q11: The below figure shows the various combinations
Q18: The below figure shows the various combinations
Q23: Suppose two out for coffee and donuts
Q26: The table below shows the total utility
Q40: The below table shows the average utility
Q50: The below figure shows the various combinations
Q61: The table below shows the total utility
Q139: The below figure shows the various combinations