True/False
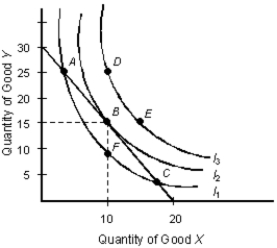
The below figure shows the various combinations of the goods X and Y that yield different levels of utility.Figure 7.3

-Suppose that apples and bananas both cost the same, but the marginal utility of bananas is twice as high as that for apples. This implies the consumer should purchase more apples and fewer bananas in order to maximize utility.
Correct Answer:

Verified
Correct Answer:
Verified
Q128: The table given below depicts the total
Q129: The below table shows the average utility
Q130: The below figure shows the various combinations
Q131: The table below shows the total utility
Q132: The table below shows the total utility
Q134: The table below shows the total utility
Q135: The below table shows the average utility
Q136: The below figure shows the various combinations
Q137: Scenario 5.1<br>The demand for noodles is given
Q138: The table below shows the total utility