Multiple Choice
The figure given below shows the demand curves for five products: A,B,C,D,andE. Figure 5.1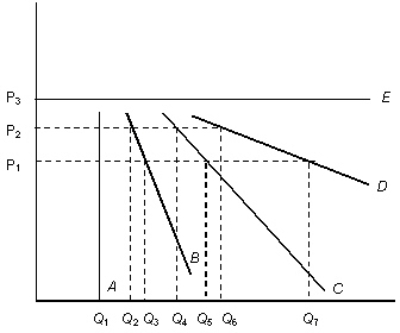
- Refer to Figure 5.1.The value of the coefficient of price elasticity of demand for E is:
A) more elastic compared to demand curve E.
B) less elastic compared to demand curve C.
C) perfectly elastic.
D) more elastic compared to demand curve D.
E) an example of a unit-elastic demand curve.
Correct Answer:

Verified
Correct Answer:
Verified
Q37: The figure given below shows the demand
Q71: The figure given below shows the demand
Q81: Scenario 5.1 The demand for noodles is
Q84: If firms have to change their production
Q84: The figure given below shows the demand
Q88: Demand becomes more elastic as:<br>A)the number of
Q89: _ measures the percentage change in quantity
Q104: Scenario 5.1<br>The demand for noodles is given
Q108: Scenario 5.1<br>The demand for noodles is given
Q126: Scenario 5.1<br>The demand for noodles is given