Multiple Choice
The figure given below shows the demand curves for five products: A,B,C,D,andE. Figure 5.1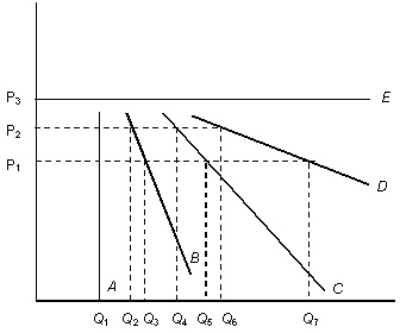
- Refer to Figure 5.1.The demand curve E is most likely to represent the demand for:
A) alcohol by an alcoholic.
B) a life-saving drug.
C) holiday travel packages.
D) a particular brand of breakfast cereal.
E) air conditioning during a hot summer.
Correct Answer:

Verified
Correct Answer:
Verified
Q7: Scenario 5.1<br>The demand for noodles is given
Q48: Scenario 5.1 The demand for noodles is
Q48: The figure given below shows the demand
Q49: In which of the following cases will
Q52: Goods whose income elasticity of demand is
Q53: If <img src="https://d2lvgg3v3hfg70.cloudfront.net/TB1750/.jpg" alt="If =
Q54: Since an expensive sports car constitutes a
Q55: If consumer income increases,then the demand shifts
Q60: The figure given below shows the demand
Q99: Scenario 5.1<br>The demand for noodles is given