Multiple Choice
The figure given below represents the equilibrium price and output in the market for restaurant meals and delivery meals. Figure 4.1 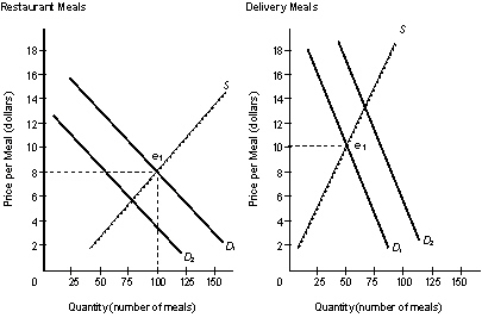
- Refer to Figure 4.1.Which of the following is represented by this figure?
A) Delivery meals and restaurant meals are complementary goods.
B) When producers of delivery and restaurant meals change their preferences,the consumers respond.
C) The increase in demand for delivery meals could have been caused by a change in consumers' tastes.
D) The fall in demand for restaurant meals was caused by an increase in the price for restaurant meals.
E) The demand for delivery meals is less elastic than that for restaurant meals.
Correct Answer:

Verified
Correct Answer:
Verified
Q3: Scenario 4-1<br>In a given year, country A
Q5: Scenario 4-1<br>In a given year, country A
Q13: Which of the following is true of
Q28: Which of the following will invariably be
Q30: Which of the following situations is an
Q32: According to the World Development Report published
Q34: The term net exports refers to:<br>A)the situation
Q36: In a market system,which of the following
Q50: Which of the following institutions form the
Q59: Scenario 4-1<br>In a given year, country A