Multiple Choice
The figure given below represents the equilibrium price and output in the market for restaurant meals and delivery meals. Figure 4.1 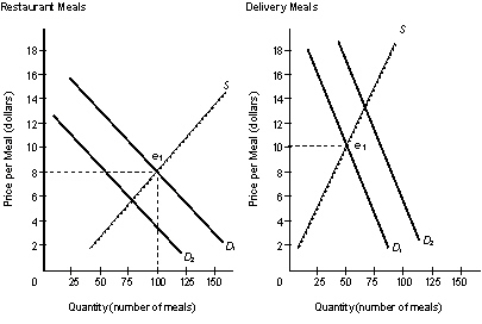
- Refer to Figure 4.1.Identify the impact on the price of Restaurant Meals and Delivery Meals following the direction of the shifts in demand in these two industries.
A) The price of Restaurant Meals rises while the price of Delivery Meals declines.
B) The price of both Restaurant Meals and Delivery Meals declines.
C) The price of Restaurant Meals declines while the price of Delivery Meals rises.
D) The price of both Restaurant Meals and Delivery Meals rises.
E) The price of Restaurant Meals and the price of Delivery Meals add up to $10.
Correct Answer:

Verified
Correct Answer:
Verified
Q6: Identify the international organization that makes loans
Q22: When a household owns shares of stock,
Q26: Scenario 4-1<br>In a given year, country A
Q31: Scenario 4-1<br>In a given year, country A
Q36: Which of the following is a defining
Q62: When the government sector is included in
Q63: A trade deficit involves:<br>A)net flows of goods
Q64: Scenario 4-1 In a given year,country A
Q65: Which of the following is true of
Q70: Which of the following economic indicators is