Multiple Choice
The figure given below represents the equilibrium price and output in the market for restaurant meals and delivery meals. Figure 4.1 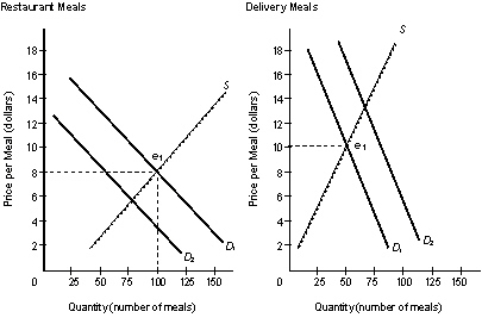
- Refer to Figure 4.1.If the price in the Delivery Meals market remains at $10 but demand shifts to D2 which of the following situations will be observed?
A) People would be willing and able to purchase 75 units while only 60 units would be available.
B) People would be willing and able to purchase only 60 units while 75 units would be available.
C) People would be willing and able to purchase 75 units while only 50 units would be available.
D) People would be willing and able to purchase 75 units while only 25 units would be available.
E) People would be willing and able to purchase 50 units and producers would supply exactly 50 units.
Correct Answer:

Verified
Correct Answer:
Verified
Q4: The idea that in a market system
Q7: The figure given below represents the circular
Q8: Consider the circular flow of income model
Q9: The process of new products and new
Q10: In economics parlance,the term investment refers to:<br>A)the
Q11: Scenario 4-1<br>In a given year, country A
Q11: Which of the following is a valid
Q38: Scenario 4-1<br>In a given year, country A
Q44: Scenario 4-1<br>In a given year, country A
Q47: Scenario 4-1<br>In a given year, country A