Multiple Choice
Figure 3-11
The graph below represents the various combinations of ham and cheese (in pounds) that the nation of Bonovia could produce in a given month.
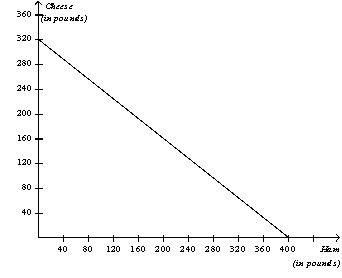
-Refer to Figure 3-11.In the nation of Cropitia,the opportunity cost of a pound of cheese is 1.5 pounds of ham.Based on this information,if Bonovia and Cropitia want to trade,Cropitia should specialize,in the production of
A) ham and import cheese.
B) cheese and import ham.
C) both goods and import neither good.
D) neither good and import both goods..
Correct Answer:

Verified
Correct Answer:
Verified
Q19: Figure 3-8<br>Chile's Production Possibilities Frontier<br>Colombia's Production Possibilities
Q21: For international trade to benefit a country,
Q40: Consider two individuals - Howard and Mai
Q50: Suppose there are only two people in
Q59: Trade can benefit everyone in society because
Q65: In one month, Moira can knit 2
Q78: Julia can fix a meal in 1
Q136: If Shawn can produce donuts at a
Q440: Table 3-8<br>Assume that Huang and Min can
Q442: Suppose a gardener produces both green beans