Multiple Choice
Figure 5-12 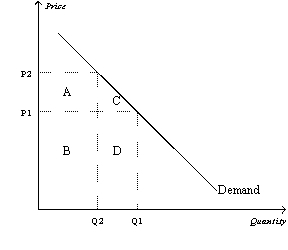
-Refer to Figure 5-12. Total revenue when the price is P2 is represented by the area(s)
A) B + D.
B) A + B.
C) C + D.
D) D.
Correct Answer:

Verified
Correct Answer:
Verified
Q34: Scenario 5-2<br>The supply of aged cheddar cheese
Q64: The income elasticity of demand is defined
Q74: Cross-price elasticity of demand measures how<br>A)the price
Q98: Figure 5-1<br> <img src="https://d2lvgg3v3hfg70.cloudfront.net/TB7555/.jpg" alt="Figure 5-1
Q103: When demand is elastic,a decrease in price
Q141: Figure 5-9<br> <img src="https://d2lvgg3v3hfg70.cloudfront.net/TB2185/.jpg" alt="Figure 5-9
Q209: Suppose you are in charge of setting
Q246: For a particular good,a 10 percent increase
Q295: Figure 5-3 <img src="https://d2lvgg3v3hfg70.cloudfront.net/TB2297/.jpg" alt="Figure 5-3
Q297: If a 20% increase in price for