Multiple Choice
Table 7-10
-Refer to Table 7-10. You want to hire a professional photographer to take pictures of your family. The table shows the costs of the four potential sellers in the local photography market. Which of the following graphs represents the market supply curve?
A) 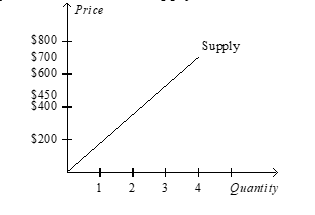
B) 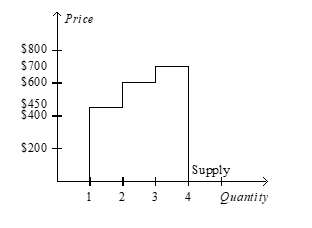
C) 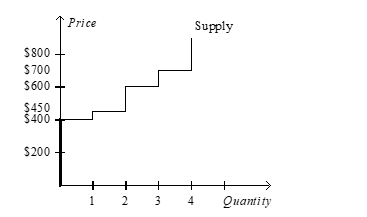
D) 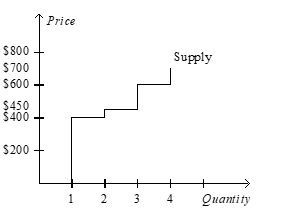
Correct Answer:

Verified
Correct Answer:
Verified
Q1: Welfare economics is the study of how<br>A)the
Q8: If the government allowed a free market
Q33: Table 7-4<br>The numbers in Table 7-1 reveal
Q45: Figure 7-19<br> <img src="https://d2lvgg3v3hfg70.cloudfront.net/TB2185/.jpg" alt="Figure 7-19
Q62: Figure 7-8<br> <img src="https://d2lvgg3v3hfg70.cloudfront.net/TB2185/.jpg" alt="Figure 7-8
Q155: Economists argue that restrictions against ticket scalping
Q253: Table 7-1<br> <img src="https://d2lvgg3v3hfg70.cloudfront.net/TB2185/.jpg" alt="Table 7-1
Q306: When the supply of a good increases
Q314: Table 7-8<br>The only four producers in a
Q429: Figure 7-15<br> <img src="https://d2lvgg3v3hfg70.cloudfront.net/TB2185/.jpg" alt="Figure 7-15