Multiple Choice
Figure 7-12
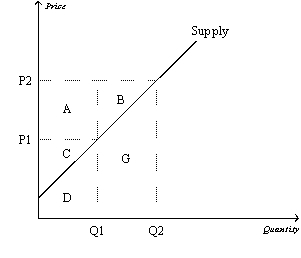
-Refer to Figure 7-12.When the price rises from P1 to P2,which area represents the increase in producer surplus to existing producers?
A) A
B) A+B
C) A+B+C
D) G
Correct Answer:

Verified
Correct Answer:
Verified
Q53: If the United States changed its laws
Q71: When demand increases so that market price
Q86: Another way to think of the marginal
Q123: If the government imposes a binding price
Q380: Figure 7-14<br> <img src="https://d2lvgg3v3hfg70.cloudfront.net/TB2185/.jpg" alt="Figure 7-14
Q381: Table 7-1<br> <img src="https://d2lvgg3v3hfg70.cloudfront.net/TB2185/.jpg" alt="Table 7-1
Q383: Table 7-7<br>The following table represents the costs
Q384: Figure 7-9<br> <img src="https://d2lvgg3v3hfg70.cloudfront.net/TB2185/.jpg" alt="Figure 7-9
Q387: Figure 7-9<br> <img src="https://d2lvgg3v3hfg70.cloudfront.net/TB2185/.jpg" alt="Figure 7-9
Q388: Table 7-6<br> <img src="https://d2lvgg3v3hfg70.cloudfront.net/TB2185/.jpg" alt="Table 7-6